Quick Overview:
Learn how to calculate dollar and percent changes in Excel to compare values over time. This guide explains simple formulas to find differences and percentage increases or decreases, helping you analyze trends, measure performance, and make better data-driven decisions using clear, easy-to-apply techniques.
How do you compare the differences in data between two years or other time periods? How do you compare data between two different locations, people, or categories? To help with comparisons, how can you further calculate a percent change between the two values? These are questions I hear during Excel training classes and as a conference speaker. Whether comparing different time frames or key data categories, it’s easy in Microsoft Excel to calculate a change in value or a percentage change. Yet it’s not obvious if you don’t create a lot of formulas in Excel.
How to Calculate Differences in Values
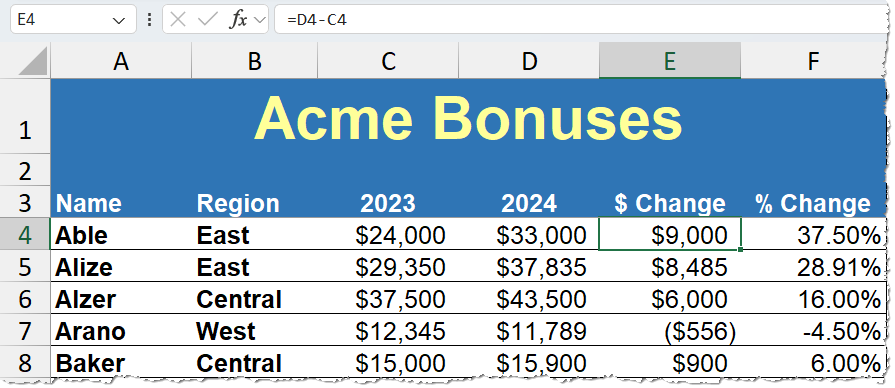 Let’s cover the basics of the calculation first. This is a simple subtraction formula. In the example where the first year is in Column C and the second year is in Column D, the formula in Column E is:
=D4-C4
Then, copy the formula down for the balance of the worksheet data. This column is optional, yet it creates a baseline for the comparisons and could be referenced by other formulas, as in the next example.
How to Calculate a Percent Change in Values
 We’ll use the sample example to calculate the percent change between values. The formula simply calculates the difference between the two time periods, such as the Current Year and the Previous Year, and then divides the result by the value of the Previous Year. The formula in the example above for the % Change column (Column F) is:
=(D4-C4)/C4 (works whether or not you’re also calculating the value difference) OR
=E4/C4 (if you’re also calculating the difference in the dollar or quantity values as in the example above)
Next, format the column with the Percentage format, and you’re good to go!
To see these simple calculations in action, download the sample workbook.
To extend your learning on Microsoft Excel, check out these other shortcuts, tips, and techniques at TheSoftwarePro.com/Excel.
© Dawn Bjork, MCT, MOSE, CSP®, The Software Pro®
Microsoft Certified Trainer, Productivity Speaker, Certified Speaking Professional